Subscription Performance Benchmark ReportSpring 2021

Contents

Piano works with hundreds of organizations — including many of the world’s largest media properties — that collectively manage thousands of websites and billions of visitors. This vast network provides an unparalleled benchmark dataset through which we can understand digital engagement, conversion and retention trends. We’ve shared this data directly with our clients, presented it at events and seen it covered by the media. And now for the first time ever, we are making it available to a wider audience through our inaugural, bi-annual Benchmarks Report. In each report, we will track the numbers that matter most to publishers looking to launch or optimize a subscription business — engagement, exposure rate, conversion rate and retention rate.

In this first edition, we deep dive into our learnings from a year in which we saw a surge in subscriptions, due in part to COVID-19 and in part to a shift in consumer acceptance to support and pay for good journalism. The largest subscription sites on Piano’s platform saw median active subscription growth of nearly 58 percent. By April of 2020, multiple Piano clients were telling us they’d already met their annual subscription goals. What these numbers demonstrate is that content-driven subscription businesses can grow at an incredible pace during moments of high demand. Whether the circumstances generating that demand are sporting events, stock market fluctuations, political turmoil or a pandemic, being prepared for these shifts in consumer demand, and adapting content and marketing strategies as the top stories change, is critical to running a successful subscription business.

Engagement

We typically define engagement in relation to active days, as it's the best measure of habit. The biggest engagement trends we saw over the last year involved a shortened sales funnel given the surge in traffic to news sites — and, consequently, the need for an onboarding program to reduce the risk of losing new subscribers early.

Sales funnels shortened

We’ve known for years that a sizable share of an audience converts on their first active day in the month. But we recently uncovered how pre-conversion engagement changes as subscription products grow up.

Active days before conversion

In Year 1 of a subscriptions business, 43% of conversions are driven by users visiting 5 or more days in a month, while only 33% are driven by first-day visitors. By Year 2, those ratios flip.

The above chart shows the share of conversions by active day for Piano clients in the first year of their subscription business compared with the second year. In the first year, about 43 percent of conversions are driven by users visiting five or more days in a month, while only 33 percent are driven by first-day visitors. But by the second year, those ratios flip, with about 41 percent of conversions happening on the first day, and only 32 percent of conversions from the five-plus cohort.

That shift from high engagement users to lower engagement starts quickly. By the third month in market, the share of 10+ active day converters begins to drop, and the share of first-day converters grows.

That’s an important insight. While it’s certainly true that you can expect your most loyal users to convert in the early days of a new subscription offering, you’ll need to pivot pretty quickly to adopting tactics that help convert lower-engagement users. These tactics might include trials or promotional pricing, as well as refining your product to increase its appeal to visitors who don’t know your brand quite as well. It also means ensuring you’re exposing subscription offers to users early in their customer journey.

Onboarding’s importance has only increased

In the first days of a subscription, onboarding is important to drive engagement, which is important to retention as well as acquisition. If subscribers don't engage early, they often cancel quickly, or become a doomed "sleeper" and stop visiting the site, even if they're still subscribed. “Sleepers” are active subscribers who haven’t visited the site in the past 30 days. As evidenced in the chart below, a whopping 40 percent of subscribers are sleepers for the average media site.

Active days in January 2021

"Sleepers" are active subscribers who haven’t visited the site at all in the past 30 days — they make up 40% of subscribers.

Unsurprisingly, these disengaged subscribers tend to account for a significant share of cancellations overall. While a sleeper might take many months to get around to cancelling, about half of them on annual subscriptions and two-thirds on monthly subscriptions are gone within a year of going inactive.

Our research shows they fall asleep fast — 60 percent of sleepers first become inactive within the first two months of their subscription— making it incredibly important to use an onboarding program and implement other tactics to drive engagement and habit early in the relationship.

Exposure Rate

Exposure rate, the percentage of a site’s unique visitors who are shown a paid offer, remained quite high even after the initial months of 2020. This was partially thanks to the pandemic and partially thanks to another factor we will get into in more detail below.

Targeting sustained the surge

While the pandemic was the original subscription accelerant, the higher subscription acquisition rate hasn’t disappeared as COVID has worn on. We believe this is because the pandemic made many media companies realize that subscription dollars are vital to their future health, which has increased the seriousness with which they market their subscription products. One of the main proof points for this theory was the dramatic increase in the share of visitors on a given site asked to pay. By the fourth quarter of last year, the median share of visitors seeing a paid offer was 10.9 percent — more than double the share in Q4 2019.

Business maturity also played a role. We looked at two groups of sites: those on the Piano platform that launched before July 2019 and those that launched from August 2019 onward. What we found was that long-tenure sites have dramatically higher paid exposure rates, with 15.2 percent of visitors on those sites seeing a paid offer in Q4 — almost three times that of more recently launched sites.

Share of visitors exposed to paid offers

15.2% of visitors to longer-tenure sites saw a paid offer in Q4 — almost three times that of more recently launched sites.

That's likely a mix of necessity and experience. If you’re in-market longer, you’ve learned what works, and how to optimize your marketing. And you need to sustain your growth by converting users who have lower brand affinity, which tends to include broader targeting strategies.

Conversion Rate

“What’s my conversion rate going to be?” is probably the most common question we get from clients. We define conversion rate as the percentage of visitors seeing a paid offer who convert. It’s much more common to succeed with subscriptions through high exposure and low conversion rates than the reverse. The average paid conversion rate is ~0.2 percent, but there is a range; our clients see conversion rates from over 10 percent to a couple hundredths of a percent. Here’s why.

Message placement matters

Conversion depends quite a lot on the mix of subscription messages and how often each type is shown to users. There are four basic ways users see subscription offers:

  1. A subscription landing page, to which the user chooses to navigate
  2. A “hard” paywall that prevents users from reading or viewing more without taking action
  3. A “soft” paywall that interrupts their reading, but can be dismissed without paying
  4. A ribbon or other gentle notification that covers only part of the page, doesn’t interfere with reading and can be easily ignored

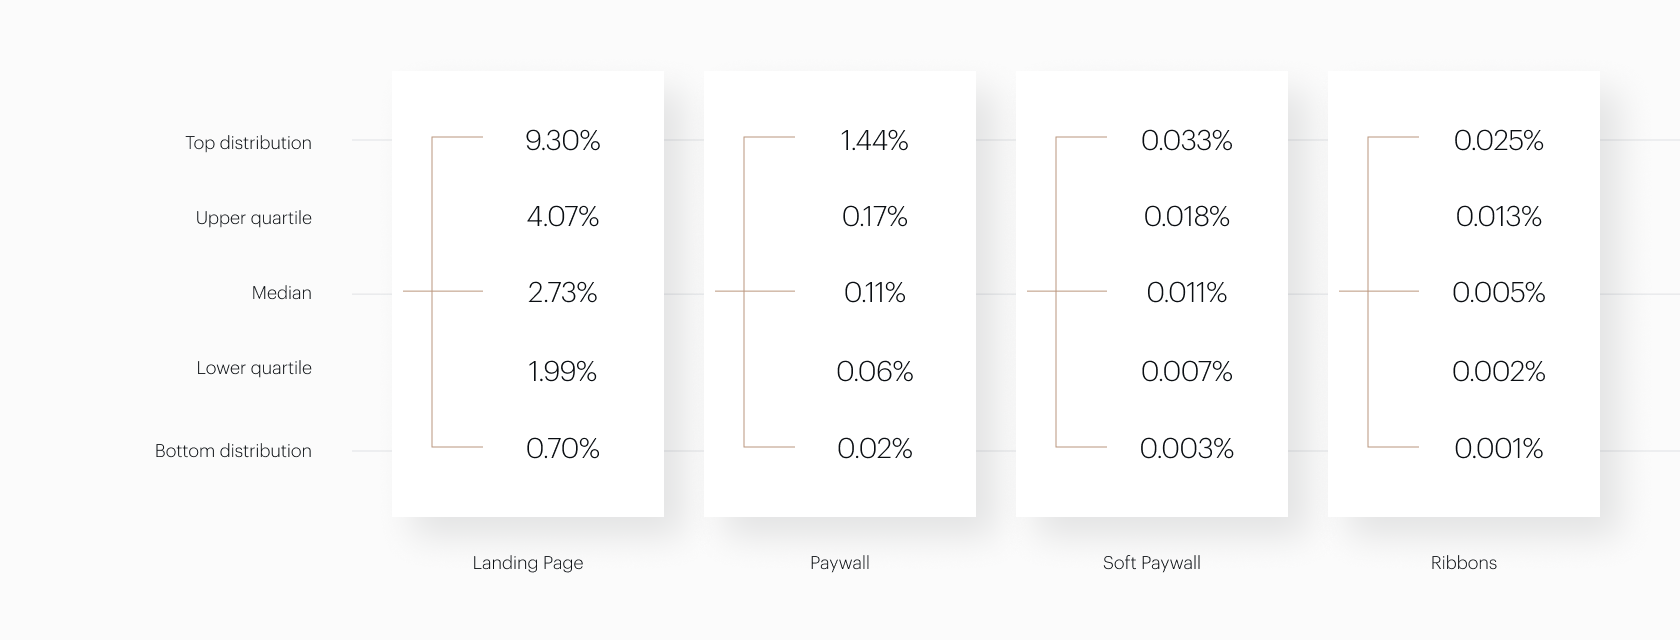
Those different paid templates, as we call them in the Piano platform, play different roles in the conversion journey, and so have very different exposure and conversion rates:

Those different formats and exposure tactics produce very different conversion rates. And of course, there’s a range of performance within each of those types, driven by price, messaging, product, exposure rates, page layout and more.

Conversion Rate by Experience

Hard paywalls have 10x higher conversion rates than soft paywalls, which have double the conversion rate of bottom ribbons.

Focusing on the median, you can see in the chart above that landing pages have 25 times higher conversion rates than hard paywalls. Landing page conversions, however, are often a consequence of other tactics. They may be visitors who were previously stopped by the paywall, visitors who are searching out your subscription offering from paid campaigns or word of mouth or are otherwise highly primed to buy.

Clearly, you should invest a lot of time in optimizing your landing pages. But the hard paywall, even at a fraction of the conversion rate, is often the lever that has the most impact on conversions overall, since you control the number of visitors intercepted by it. Hard paywalls have 10 times higher conversion rates than soft paywalls, which have double the conversion rate of bottom ribbons, as seen below.

The bottom line is that you can’t think of these offers as entirely independent. For example, an effective bottom ribbon may prime a visitor to convert at a higher rate (or retain better) when they hit the paywall. But the numbers do show the most important types of subscriber messaging to optimize.

Free trials faded

Seventeen percent of new monthly subscriptions in January of 2020 included a free trial. By December of 2020, fewer than 5 percent of monthly subscriptions included one. This indicates that publishers are getting more confident in their pricing and smarter about promotional strategies, since free trials often don't make financial sense when carefully analyzed.

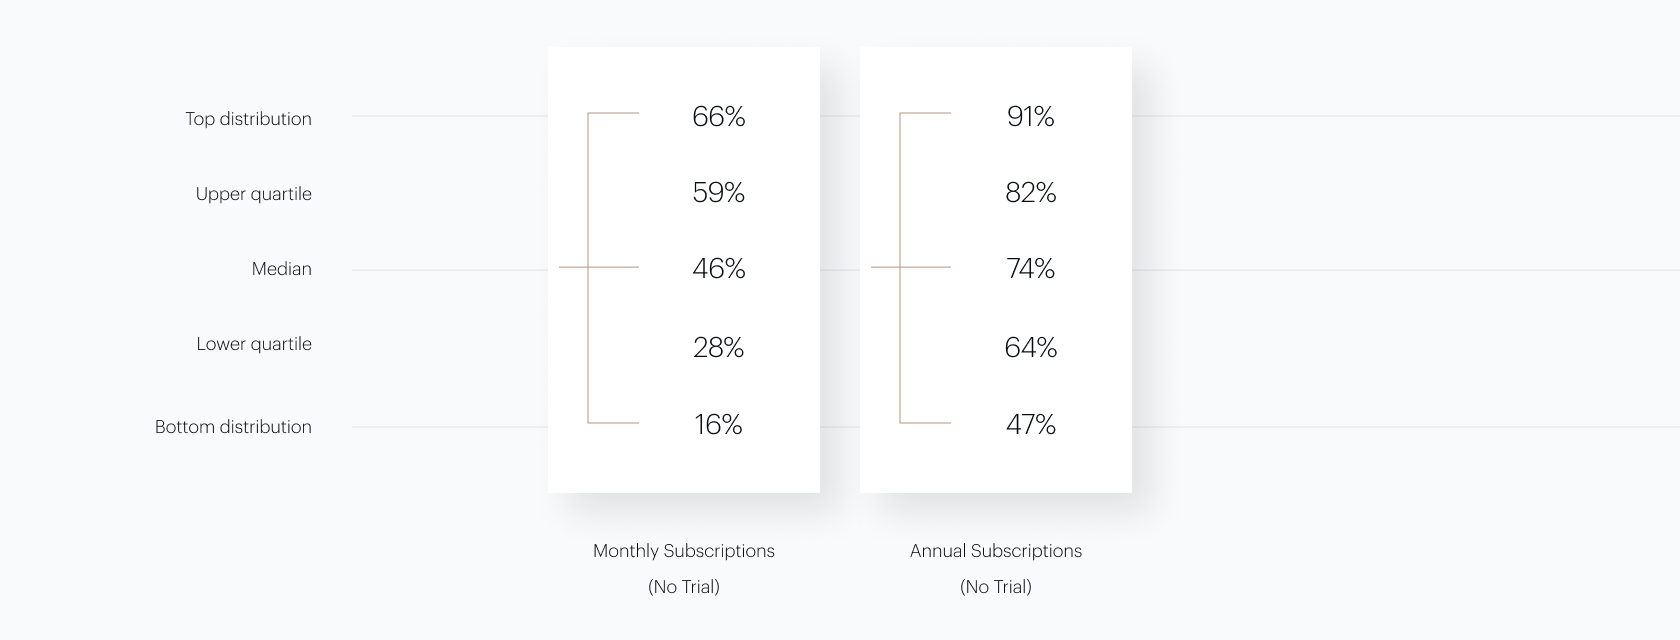
Trials generally have a big impact on retention. Non-trial monthly subscriptions have a median retention rate of 86.1 percent from the first month to the second. Paid trials, even at a relatively low price like $1, retain 82.1 percent when the trial period is over. But free trials retain only 61.7 percent when users have to start paying — with significantly lower lifetime value as a result.

Conversion Rate by Trial Offer
86.1% First-month retention for monthly offers without trials
82.1% Paid trials converting to full price
61.7% Free trials converting to full price

Trial periods are important drivers of acquisition — there are instances where the conversion rate doubles due to a trial offer. But free trials often don’t increase conversion rate significantly above paid trials, making a paid trial the better choice in most instances due to higher retention.

Given the decline in free trials over the course of 2020, this appears to be increasingly widely understood amongst executives running subscription businesses.

Retention Rate

Retention rate, the percentage of subscribers in a cohort who continue to subscribe over a given time period, has become a chief focus of many of our clients who launched subscriptions businesses last year. It turns out that the tenure of both your subscription business and the actual subscription (monthly vs. annual) plays a big role.

Subscription tenure matters

As seen below, churn rate is highest in the first month — 80 percent of it from active churn. The higher risk of cancellation within the first days and months of a subscription is one reason it’s beneficial to have onboarding campaigns that introduce users to the benefits of the subscription and encourage early usage and engagement.

Churn Rates

Churn rate is highest in the first month — 80% of it from active churn.

Piano’s cancellation propensity algorithm frequently finds that subscription tenure, the number of days since subscription conversion, is among the metrics most strongly associated with cancellation risk. Subscribers who have stuck around long enough to make multiple full-price payments are much more likely to continue to subscribe.

Subscribers stuck around

Coming out of the pandemic subscription surge, many clients and media analysts expected elevated churn for a huge share of the newly acquired subscribers. That has not been the case.

Monthly subscriptions signed up after the World Health Organization declared a pandemic in March of 2020 have retained better than monthly subscriptions converted before the pandemic.

The covid subscription bump

Monthly subscriptions signed up after the pandemic was declared in March of 2020 have retained better than monthly subscriptions converted before the pandemic.

One reason for improved retention: the newscycle effectively onboarded new subscribers, with the torrent of news keeping subscribers engaged and getting them through the high-cancellation risk early days of a subscription.

Long-term subscriptions grew

Historically, around two-thirds of new subscriptions acquired during any given month on Piano’s platform have been monthly. However, because annual subscriptions retain so much better with higher lifetime value, there is an obvious strategic rationale for encouraging annual commitments.

The obvious difference is that monthly subscribers have 12 chances to cancel or have a payment failure over the course of a year, while annual subscribers have only one. When comparing performance over the first year of a subscription in the chart below, at the median, only 45 percent of monthly subscribers are left at the end of that year, while 75 percent of annual subscribers remain.

Monthly vs Annual Subscription Retention

Only 46% of monthly subscribers are left at the end of the first year of a subscription business, while 74% of annual subscribers remain.

In the final months of 2020, an increasing share of Piano clients used smart promotions and pricing strategies to make annual subscriptions more attractive — with special offers on Black Friday and Cyber Monday more than tripling daily subscription conversions for a range of clients. By understanding retention rates and, by extension, lifetime value, these clients were able to give their subscribers a great deal while increasing revenue and growing a more sustainable subscription business as seen below.

Share of Subscriptions

Special offers on Black Friday and Cyber Monday more than tripled daily subscription conversions for a range of clients.

Conclusion

The above is just a fraction of the benchmark data Piano has at its fingertips. We feel these metrics — engaged users, exposure rates, conversion rates and retention rates — are the most critical to understanding the health of your subscription business. If your goal in 2021 is on retaining subscribers, using pricing to shift the balance toward annual subscriptions, employing trials carefully to reduce early churn, adopting an onboarding program and targeting high-risk users with rescue tactics can have a big impact.

About Piano

Piano helps organizations understand and influence customer behavior by putting the power of insights and logic into the hands of their employees. The Piano Analytics and Activation Platform measures thousands of customer data points and acquires first-party data to more deeply engage users and then serve relevant content and experiences based on their unique behaviors and profiles. Using this powerful end-to-end platform, Piano’s clients have achieved more scale, engagement and revenue by expanding the lifecycle and value of every digital interaction. Piano’s global customer base includes IBM, CNBC, Nielsen, The Wall Street Journal, NBC Sports, Gannett, The Telegraph, the BBC, Kirin Holdings and more. Piano has been recognized as one of the fastest-growing, most innovative technology companies in the world by Red Herring, World Economic Forum and Deloitte, won Data Management Solution of the Year from Data Breakthrough, nabbed Best MarTech Startup by MarTech Breakthrough and garnered Organization of the Year in the Business Intelligence Group’s “The Sammys.” For more information, visit piano.io.

Get in touch to learn more about our platform and services.

Talk to Us